The percentages you get for regions are the most likely results we get after comparing your DNA to our reference panel, but they're not the only results. Other possibilities could be nearly as likely. This is why we present your results as a range of possible percentages.
This is true of any DNA company’s results on the market. We're transparent about what our results mean. And we continually offer ever-more-accurate results.
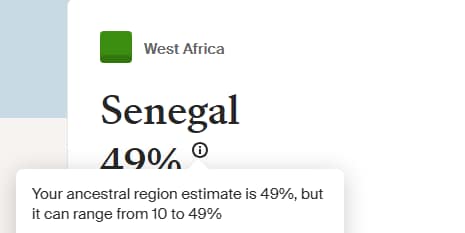
49% can be 10–49%
Imagine your results say you're 49% Senegal. That 49% is the most likely number within a range of percentages that are also likely—less likely, but not necessarily by much.
Select a region in your results to see your range for that region.
These ranges are important, especially for results with lower percentages. In these cases, the range can sometimes include zero. This means that for these results, it is possible that your ancestors didn’t live in that region or you didn’t inherit any DNA from ancestors who did.
How the range is calculated
We compare your DNA to our reference panel to generate 1,001 possible results for each region. We use these results to determine their ranges, which may be different than the percentages you see. How we calculate a region's range depends on the region and the value of your most likely result.
Review our ancestral regions white paper to learn more about how we calculate these ranges.